1. Tega commenced operations in 1978 in India with a foreign collaboration with Skega of Sweden with an objective of providing unique products and services for handling complex problems in material handling and mineral processing.
2. Tega is one of the leading manufacturers of specialized ‘critical to operate’ and recurring consumable products (specialized abrasion and wear-resistant rubber, polyurethane, steel and ceramicbased lining components) for the global mining, mineral processing, and material handling industries.
3. We are the second largest producer of polymer-based mill linings as well as one of the largest players providing hybrid liners across semi-autogenous and ball mills.
4. We have close to 55 products in our portfolio spread across multiple geographies globally.
5. Today we operate 6 manufacturing plants across the world with three in India and three in overseas locations
6. Almost 85% of the revenues is generated outside of the country.
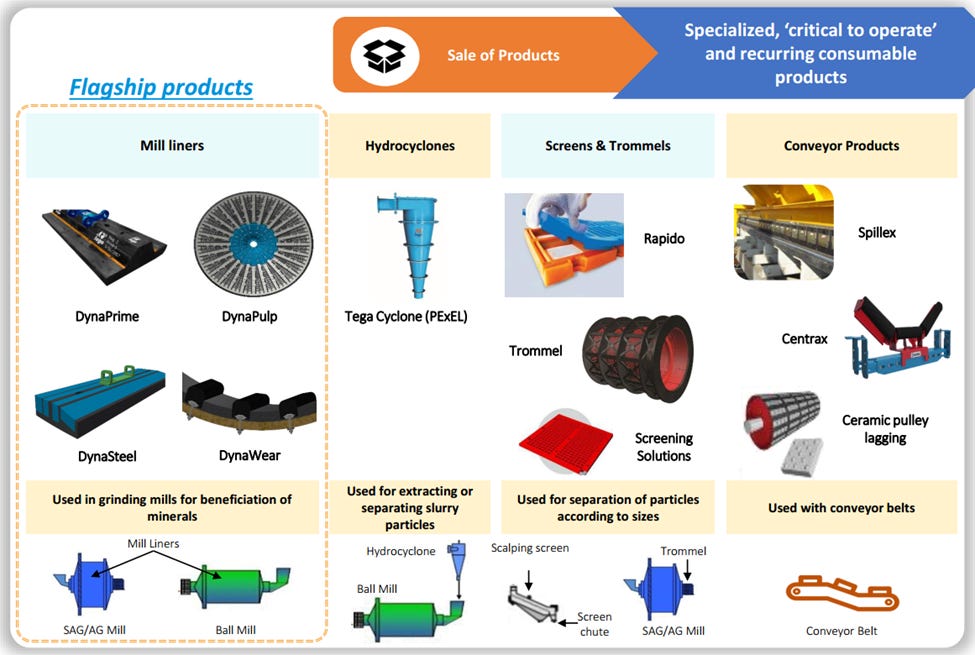
7. The product basket comprises products like Mill liners, Conveyor components, Wear Resistant Liners, Screening Solution, Trommel, Hydrocyclones and Slurry Transportation.
· The global grinding mill liner is expected to grow at a CAGR of 5.5% from 2021 to 2028. Metallic mill liners are expected to dominate the market by 2030. . The global market size for hydro cyclones was estimated at USD 617 Million in 2020 and projected at USD 1.2 Billion by 2030, growing at a CAGR of 3.2% over the forecasted period 2020-2027.
· Gold and Copper constitutes about 70% of sale of products. The demand for iron ore, copper, and other metals & minerals is expected to drive the mineral processing industry while electric vehicle manufacture could catalyse the demand for copper, aluminium and other metal
Revenue Pattern on quarterly basis: revenues build up throughout the financial year starting from a moderate Q1 and finishing higher in Q4. Hence the performance analysis of year-on-year versus quarter-on-quarter for our business will be more relevant.
Headwinds: The Company suffered an increas in its raw material cost (RMC) margin from the desired 60% to 57.7%. There was an abnormal increase in input and logistics cost that could not be completely passed on to customers. The cumulative inflation impact of 380 bps moderated the Company’s Operating EBITDA margin from 23.27% to 19.21%
The Company’s revenue visibility was protected by the ‘must run’ status of its downstream customers, which warranted a periodic use of the Company’s products. A decline in capacity utilization of the plants of its customers did not affect purchases. The Company’s prospects were secured by its derisked ‘sell and make’ approach as opposed to its ‘make-to-sell’ business (which could have increased inventory).
Key RM: steel, rubber, carbon black, polymers etc
The Company will increase research investment from 1% of revenues to 3% of revenues even as the revenue base of the economy continues to widen.
Mill Liners: All mill operators need to maximise process efciency, throughput, energy consumption efciency, mill availability and uptime. These needs are addressed through our DynaMax range of products. Mill liners are considered critical as they directly influence the particle breakage inside the mill, affecting product quality or fnal metal recovery during the fnal benefciation process. The DynaMax range of mill lining products comprises DynaPrime, DynaSteel, DynaPulp and DynaWear, all flagship products. These mill liners offer optimal grinding solutions in key mineral processing plants, replacing steel liners in semi-autogenous mills due to their superior performance. DynaPrime enhances safety; bolting from outside and lower weight of the lining ensures reduction of liner installation risk. Your Company’s engineering capabilities to design and manufacture, successfully delivers the comprehensive solution in mill lining for optimal grinding
Bulk material handling and mineral processing products: Your Company’s major conveyor products include Spill-ex skirt sealing system, Centrax, belt sway control system Ceramic pulley lagging. Friflo impact pad, Universal support system, Jumbo: Impact Bed system and conveyor belt cleaners, among others. Tega Conveyor Components division deals with a range of products that promotes the idea of clean, safe and uninterrupted conveying for belt conveyors handling bulk solids. These products fnd application in steel plants, cement plants, power plants, ports and in mines having ferrous and non-ferrous minerals. Our products Spill-ex, Wing Seal, Eco-flip Skirt Sealing System, Friflo and Jumbo Impact beds ensure spillage-free loading zone. Centrax helps keep the belt on track. Spill-ex Ceramic Pulley Lagging helps to minimise belt slippage in the conveyor belt system.
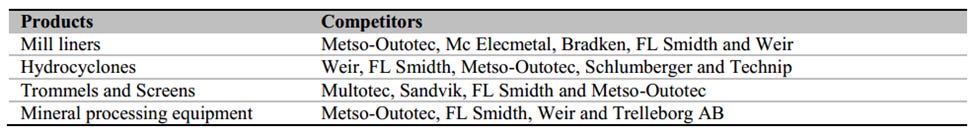
Competitors: Targeting to gain market share from 5% at present to 7-8% in coming years. They are already gaining market share
Strengths:
· Immunity from mining Capex Cycles: Majority of the products are linked to the opex budget of the mining site. Thus, the company is insulated from capex cyclicality of mining players. Management believes that it can pass-through entre costs with lag of one to two quarters. The company caters to both afer-market spends and upfront capex of mining players. Over the lifecycle of the mill, afer-market spend is generally 3x of upfront capex and its recurring costs for miners leading to high repeat orders (Comprises of sale of products and services for the company), which stood at 75-80% over FY19-22.
· High Entry barriers: Generally, in mineral processing sites, switching costs for the customers are high on account of high cost of inital planning involved, the lead tme required for approval, degree of certainty of the products of an established supplier, the high cost of downtme or shut down of a site, and relatvely lower percentage cost of components in the total operatng costs of a mineral processing site. New customer conversion typically takes 12 months which includes six months of product trials and validaton which is a reflecton of high entry barriers in the industry. These approvals do not have any expiry period.
· Industry Dynamics: Gold and copper mill sites require superior quality of consumables and have higher benefciaton requirements. Across copper mines, ore grades have declined by around less than 1% per ton over the last few years. Similarly, ore grades have also depleted in the gold mines over the last few years, which has led to disproportionate industry growth of around 5-7% for mining and mineral processing equipment at each customer site. Also, decreasing ore grades has led to a greater demand for larger-sized equipment, leading to an overall growth of 17% of the mill lining industry in Fiscal 2021.
· DynaPrime Composite Mill Liners:
»In 2018, Tega launched DynaPrime, its disruptive steel lining product. This composite liner was pitched as a suitable replacement for the conventional steel liner, marked by distinctive advantages in terms of cost, endurance and price-value proposition. Tega is focused on a vast USD 1 Billion addressable market with virtually no competition. At this point, DynaPrime accounts for 22% of the Company’s revenues; however, its share is a mere 3% of the global steel lining market. The off-take of DynaPrime grew 32% during the last fnancial year; we expect to sustain off-take at 25% compounded growth across the next fve years with the objective that it account for a little less than half of our revenues by 2027
»Large sized mills using traditonal used steel liners had a lower liner life leading to higher installaton downtme. Higher downtme accounted for unplanned shut down leading to lower reliability. Overall, opportunity cost per hour of downtme could go as high as US$ 174,042. Further, constant replacement of steel liners also had concerns relating to installation safety. Upon critcal examining of the dynamics of the mill, the company has introduced DynaPrime in 2018, with its improved profle and material compositon (a composite liner of rubber and steel) to cater to higher life. DynaPrime was designed with lesser number of pieces and fxing points which ensured faster installaton. The company has incorporated new design with boltng from outside and lesser weight (35-40% lighter) of the lining which eliminated the risk during the installaton of the liner. The DynaPrime range has been designed specifcally for the bigger size of the mills where modern liner handlers are available.
»DynaPrime has set new avenues of growth for the company by replacing existng metallic liners with an addressable market size of ~US$ 900-1,000 mn where the company’s market share stands at 2-2.5%. This is an addition to the already available opportunity of US$ 400- 500 mn in composite mill liners market where the company’s market share stands at 16%.
»In FY22, DynaPrime product alone has contributed 24.1% of sales as compared to 6.7/20.4/21.4% in FY19/FY20/FY21, respectvely. DynaPrime’s revenue grew at a CAGR of 75.7% over FY19-22 on a low base. The company expects DynaPrime’s revenue momentum to continue and grow at a CAGR of 25-30% in the near to medium-term on account of benefts it provides as compared to metallic liners.
»Realization of this product is also higher by 35-40% than traditonal metallic liners. Average life expectancy of a DynaPrime in a SAG mill is ~four months whereas in a ball mill it is ~18 months.
»DynaPrime was installed in 23/28 sites in FY21/1QFY22, respectvely, which has increased to 60 as of now
Capacity expansion, capex and its utlisaton and global presence: Current total capacity is ~30,000 MT (24,558 MT in FY21). Out of which, 20,000 MT (18,000 MT in FY21) is in India and balance across Chile, South Africa and Australia. The company’s facilities are located close to mining and emerging industrial markets and material handling industries, allowing economies of scale and logistical advantages for the customers, and to insulate them from local supply or other disruptions. The company does not outsource any of the products, unlike certain competitors, which reduces the company’s external dependencies and adds ability to turnaround customized designs in a short timeframe. Current capacity utilization is ~61% (60% in FY22). Chile capacity is ~3,300 MT with utilization of ~80% and the company is expected to increase its capacity to 8,000 MT by FY25. The company expects capex of ₹700 mn in FY23E.
Order book and Revenue Trend: Having an orderbook gives revenue visibility as the orderbook at end of each quarter is executable in 3-4 months.
Patent
Positive Triggers:
1. Reducing freight cost can give the profitability a boost.
2. With increasing revenue operating leverage will play out as company has significant unutilised capacity this is evident from explosive growth in EBITDA and PBT
Valuation: With ROCE around 20% the company is available at 26 PE ratio on TTM basis which seems to be at fair value as the ROCE can improve going forward due to operating leverage. So, EBITDA & PAT can rise very fast in H2FY23. The capacity utilization was at 60% at Q1FY23 end so at full potential quarterly run rate can be 400 cr and EBITDA can be very high.
Antithesis:
1. Other players copying Dynaprime as it doesn’t look like patented. So, it can slow down the explosive growth of Dynaprime once the peers complete the development of similar products which is 2-3 years away so in the meantime Dynaprime can continue its explosive growth
2. RM Deflation reducing the top line growth offsetting the volume growth bcause company intends to keep the gross margin at 60%. Although company has not fully passed on the price hike so RM deflation will aid the gross margin to some extent. This should be asked in next concall. This might not be the case also because at Q2FY23 there was hardly any price lead growth. Also, someone asked in Q2FY23 concall if going ahead there can be inventory loss which the mgmt. told it’s the other way around because they built up the inventory at high-cost environment.
3. Forex fluctuations.
4. Increase in logistic costs.
Technical Aspects:
»The Stock is still inside the IPO base, albeit the downtrend has reversed. After the breakout of the Ascending triangle, it is basing again inside a rectangle while displaying some VCP (volatility contraction pattern) characteristics.
»Entry: An initial entry can be made at the breakout of the Rectangle around 590-595 levels with a SL at 508 or below the weekly breakout candle (tight risk).A breakout above 670 which is also the rectangle pattern target can be a pivot above which we can average up.
»Finally, a breakout above the O’ Neil Pivot around 768 can be another point to average up the stock
Quarterly Updates
Q3FY2
1. From the macro industry data, mineral processing industry is set to grow at a CAGR of 6.3% between 2020 and 2030. Infrastructure growth, shift to EVs, RE electronics, volatility hedge, etc., are key demand drivers for relevant metals. Declining ore grade enhancing demand for beneficiation products, decreasing ore grades requires a higher throughput which has led to greater demand for larger-sized equipment as well as high consumption of consumables. This is supported by the fact that our business is immune from CapEx cycles and it caters to aftermarket spend for customers which has recurring revenue in nature. So, all our products tend to be an operational expense for our clients.
2. We launched the DynaPrime range of our products in 2018. It's a composite liner which is first of its kind in the entire world, and this has helped us unlock new addressable markets for our company, which includes larger-size mills which offers greater productivity gains and cost savings for our customers as well as almost a 50% increase in life compared to traditional steel linings.
It is about 19% of the total revenue. Expecting it to be growth driver for the company.
3. Some of the key growth drivers for us would be the demand for iron ore, copper and other metals and minerals which will drive the growth for mineral processing equipment industry in time to come. We all know about the electric vehicle manufacturing which will be top demand drivers for copper, aluminum, and other metals. Global gold and copper concentrate production industry is likely to grow at a CAGR of 4.3% and 3.7% respectively between 2020 and 2030. Gold and copper mill sites require superior quality of consumables and have high beneficiation requirements. Owing to ore grade depletion, miners are required to process more ore to get the desired throughput which will boost the demand for mineral processing equipment.
4. Revenue Growth vs Volume Growth: on a 20% growth, what we see is about 10% is coming from the price and 10% coming from the volume.
5. Segmental growth: On the mill liner side, the overall growth is about 20% wherein the DynaPrime has grown at a rate of about 16% and the mill liner without DynaPrime has grown about close to 30%. On the non-mill liner, as of now, the growth is virtually flat. It's about 1%. And overall growth is about 20% for the quarter December 2021
6. Dynaprime Growth: The growth has come mainly from the India side where we have got some new orders from the North America region and we are also able to expand ourselves in the western Africa region. Those 2 areas are giving the kind of upswing in the DynaPrime segment and that is coming with the fact that we have been doing the trial in many other sites and those trials are getting converted into commercial orders.
7. Passing on the costs: We are confident that the raw material gap which is about 2.5% and we believe that it will take another 2 quarters to pass it on e will be able to pass it on. As far as logistics is concerned, which we know that it is abnormally high, it's more of that we will be able to pass through some bit of it in the coming quarters but not all the logistics cost.
8. Increasing wallet share of customers: The issue which we had discussed earlier also was on the increase the wallet share on acquired customers. What we are looking in the shortterm strategy which will be effective for the next 2 to 3 years is that DynaPrime the large customers that we are acquiring now, once we stabilize the customers from going through the trials and making them on board with regular supplies, thereafter we are looking at expanding their product portfolio with the non-mill products and this is already in operation in Chile where we will look at the non-mill growth. We will find good growth over there. Going forward, once we acquire the larger customers in rest of the world, this will happen. It's a question of 1 or 2 years lag with the acquisition of customers for DynaPrime where the following will be the rest of the products to gain market share and wallet share there.
9. Q4 will be the strongest. relevance of year-to-year growth would be more appropriate than to look at quarter to quarter or 3 quarters because DynaPrime mainly and the larger mills with life of 6 months and 12 months are in that period where it will be on the 4th quarter for us or 1st quarter of the calendar year.
10. I think we have to look at the global mining companies and their shutdown schedules. Most of them are on a calendar year. The 2nd half of the calendar year, they are on a full production run, would normally not try to have any shutdown periods over there. So, for us, the 3rd quarter and 4th quarter where we get the order and start the shipping to meet schedules in the last quarter of ours and the 1st quarter of theirs. This is what the schedule is. So, for us, the 3rd and 4th quarters become heavy not only in DynaPrime but in most of the mill liner business because the customers are timing their shutdowns to half where they are not ramping up production.
11. Order book in this period has grown around 24%. We look at the order booking for a quarter
Q4FY22
1. For the entire year, if I break the volume growth, the volume growth is about 10% and the price is about 6% and exchange is about 2%.Q4 volume growth is about 5%, price is about 10% and exchange is about 2% quarter-on quarter.
2. So DynaPrime we have growth grown about 33% Y-o-Y from Rs.172 Crores to Rs.229 Crores in FY2022 and on the non- DynaPrime section we had grown at about 16% from Rs.409 Crores to Rs.475 Crores
3. On increasing working capital days - Even in FY2021, we were at 130 days. Now if you see here that the inventory is mainly the reason for the working capital cycle goes up. It was a strategic decision by the management to ensure that we kept our inventory higher with the disruption in logistics supply chain globally and we do both export and import for our production purposes so the idea was to ensure production is not disturbed and our customer because it is a critical spares we will be able to feed them on time so that we do not lose them and hence this time we are at about 30 days higher than the normal which was kind of strategic decision and second is that you can also see that because of inventory what we have with us it also helps us to manage the margin because of the lower carrying cost of the inventory what we were having.
4. Our normal EBITDA margin is 21% to 23% and in our IPO also we said the same thing.
5. We are an operating leverage company so any increase in volume gives a good kind of EBITDA margin to us and even last year also normalized EBITDA was 22%, which we already said in our call to the investors so we are of the range of 21% to 23% kind of EBITDA margin which we believe that we should be in that range
6. I think as far as DynaPrime is concerned also the margins are similar to that of the other mills also so the difference will not be too much as far as the margins are concerned.
7. Aiming to grow Dynaprime for 25% for next few years.
8. We tend to see the Q1 to be a bit slower than the rest of the quarters and we see the revenue and EBITDA trend up starting from Q2 onwards.
9. Not giving much guidance: So as I said that as a combination we are looking at double digit growth and maybe we do not intend to give any forward looking statement in this call, but the idea is to carry over with the growth in all the segment with a kind of this proposition goes from DynaPrime.
10. So ore wise as Mr. Yaver said that about 72% we are supplying to copper and gold together and there is 28 mix of many.
11. So as of now totally around 45 sites are there where we are working with DynaPrime.
Q1FY23
1. Since this is the first time that we are declaring our Q1 results after listing I would like to explain a crucial factor in our revenue pattern. As seen in our full year results published last quarter our revenues build up throughout the financial year starting from a moderate Q1 and finishing higher in Q4. Hence the performance analysis of year-on-year versus quarter-on-quarter for our business will be more relevant.
2. The improvement of EBITDA is due to higher volume that resulting in better absorption of fixed cost also. So, in this Quarter 1 we were at about 61% of our capacity utilization.
3. Most of the growth on account of higher volumes only and some element of price as well.
4. Volume vs Value growth: So, out of this 41% growth actually there are three components. One is exchange side in the exchange we have lost about 3% YoY. And on the price side we take increase of around 13% to 14% of price side and the volume is about 30%.
5. Three broad category which talked about DynaPrime mill segment and non DynaPrime mill segment and a non-mill segment. On DynaPrime side on absolute terms, we have grown about 157% which consists of volume about 150% price 10% and exchange loss of 10%.On the mill side non DynaPrime, we have grown about 32% - again 18% is more of a business growth and 17% is about price growth. Non mill side we have grown 15% YoY i.e. 8% is about business growth and about 7% is a price growth in that.
6. Revenue Split: DynaPrime is 45.3 cr in Q1FY23 vs 17 cr in Q1FY22. Non DynaPrime mill liner is 1,38.9 cr and nonmill is 46.6 cr.
7. DynaPrime is concerned we are going to grow at 30% CAGR for the next two-three years and if you look at the figures that is happening today we are on line with that
8. Gross margin guidance: 60%
9. So, India we have dollar then Euro, AUD & CAD and as far as our other entity is concerned which is Chile and South Africa that is in Peso, ZAR locally. So, we need to convert that into INR while we make our accounts. So, there is a transition loss of 75 million
10. Orderbook: We have about close to 300 crores order book. And this is executable about close to four months.
11. Volume growth Guidance: So, as we said that we are looking for 15% to 18% of CAGR in next 3 year to 5 years, but the idea is always to surpass that. As DynaPrime is concerned we are going to grow at 30% CAGR Volume Growth for the next two-three years and if you look at the figures that are happening today we are on line with that.
12. 8% of revenue is freight cost. It was 6.5% before covid.
13. 75% of the liner business is in copper and gold. The reason being that copper to mine one ton of copper you have to process around 200 tons of ore. In gold to get 10 grams of gold you have to process one ton of ore. So, what happens is if you look at iron ore and aluminum. Aluminum the total different industry the process is different. As far as iron ore is concerned, iron ore today occurs at a very high grade around in India we have 67%-70% of the grade in globally in Brazil and all you have around 40%-45% there. So, they have to be enhanced from 45% to 67%. So, the mill requirements are much lesser over there compared to other industries. So, that is why our market share is also in gold, copper and then iron ore as Manoj said the reason being that the process requirement for the liners is accordingly.
14. Profitability of different segments: As we discussed last time also that as of now the margin in both the sides is more or less same. So, it is not something very differential margin in the DynaPrime mill liner and non DynaPrime mill liner. DynaPrime mill liner help us in create the volume in the business and idea is to just to give a push the DynaPrime in the market which will help us to clear the market and ultimately to focus on price increase. So, focus is basically today on the getting more market share with the fact that the price input cost has gone up abnormally high last year at least we have been able to pass through those prices as of now bearing 1% and 1.5% gap I mean that is what we are focusing on as of today.
15. Other peers are in the hybrid category (Dynaprime): they have to design and establish their product before they come up to the level that we are there. So, most of them are close to around two to three years behind us.
Q2FY23
1. We have seen robust sales growth almost across all our geographies. It is especially heartening to note the growth trajectory in Australia which was lagging behind due to prolonged COVID related restrictions. As we grow our scale of operations, our operating leverage enhances the profitability. This is evident in significant margin improvement in both annual and sequential terms.
2. We have an exciting lineup of projects to unlock the next leg of growth including capacity expansions in both Chile and India.
3. On Logistic Costs: So, on that freight side, yes, it has got normalized now in terms of what we had in quarter four and quarter one. So, we have been able to around kind of recover of the 50% of what we have lost last year. We lost about 1.5% and we recovered about 0.70% as of now. Now we are of the view that in next two quarters we will be able to recover the entire logistic margin loss which we had lost last year. So, maybe in quarter three and quarter four we will come to normalization of logistic cost which we have lost last year.
4. So, in our previous calls, we always said that our CAGR target is 15%, right and we are in that upper trajectory, right, where we end up, we can't kind of give a guidance to that. But the run rate is very, very great as of now, and we will be 15% target. That's what we aspire for.
5. Gross margin decline qoq: due to product and geography mix.
6. Delivered double digit growth in key metrics despite unfavorable global challenges.
7. Even though macro environment contnues to be challenging, robust sales growth seen across all geographies specially in Australia which was lagging behind due to prolonged restricton from covid.
8. Operating leverage enhancing the proftability evident from margin expansion both in annual and sequential terms.
9. Strong pending order book of 345 cr in Q2FY23.
10. Capex was funded through internal accruals and not added fresh debt during the quarter.
11. Dynaprime to grow strongly across geographies (North America, Australia) apart from LATAM. Targetng 25%+ CAGR growth and witnessing strong order booking.
12. Working capital days during the quarter at 143 days which was on the higher side in FY22 at 169 due to supply chain issues which contnue to ease.
13. Product wise revenues: Dynaprime - ₹115 cr in H1 (=32%)/70 cr in Q2FY23 , Non Dynaprime- ₹252 cr (+20%)/₹113.0 cr in Q2FYH23 (9%), Non mill liners- 126.0 cr (+40%)/80 cr(60%) – Non mill liner growth was higher due to opening up of Australia from last two quarters (remained closed due to pandemic).
14. Revenues saw 20% growth YoY wherein 18% vol growth, 2 % price growth and exchange impact was nil.
15. Management indicated that Margin ambiton is to be between 21-23%.
16. Grown in all geographies except North America which is expected to ramp in H2FY22.
17. Capex guidance- FY23 major capex done of about ₹570 mn and hardly ₹150-200 mn more to be done for FY23.
18. Geography wise H1FY22 revenues growth-South America (+31%), Africa 14, EMR-80% Asiapac 43%, North America -7% and ramp up in H2, India-37%.
19. Intent to move the WCC to 130 days.
20. Four products fling for patent and are on trial at customer places in griding process.
21. Value terms capacity to double in next 3-4 years specifc to Dynaprime and mill liners.
22. Growth rate guidance: 15% target
23. New customer: 25% revenue from new customers.
24. Taking Dynaprime global now. So it will continue to grow.
25. I mean, heartening to see that you have maintained your cost well by keeping goods in inventory. If I can probe a bit more into it, that also means that we are currently getting benefit of the low-cost inventory that we have built up last year. If, you know, sounds that since the prices have moved up and now it's coming down with easing of logistics, but still, it is up on a year-on-year basis. So, can we have some cost pressure coming because of the newer inventory replacing the older ones?: So, it's, in fact, otherwise. Because what happened when we have built the cost inventory to withstand the cost to a higher otherwise, right? So, until now we were consuming the inventory which we built up, right, in the high-cost environment. Now the cost of commodities kind of little coming down not to the extent what we are thinking of still. But if it come down from here onwards, maybe the impact of that will be seen later quarter three or early quarter four, but not before that.
26. Effect of softening gold copper iron price on order book: Copper production has increased which is massive. No challenges from copper. Iron also no impact on consumption on our products. Gold also no impact next couple of quarters.
27. Non mill products are catching up the growth as communicated earlier.
Thanks for reading The Rising Curve - Simplifying Compounding! Subscribe for free to receive new posts and support my work.